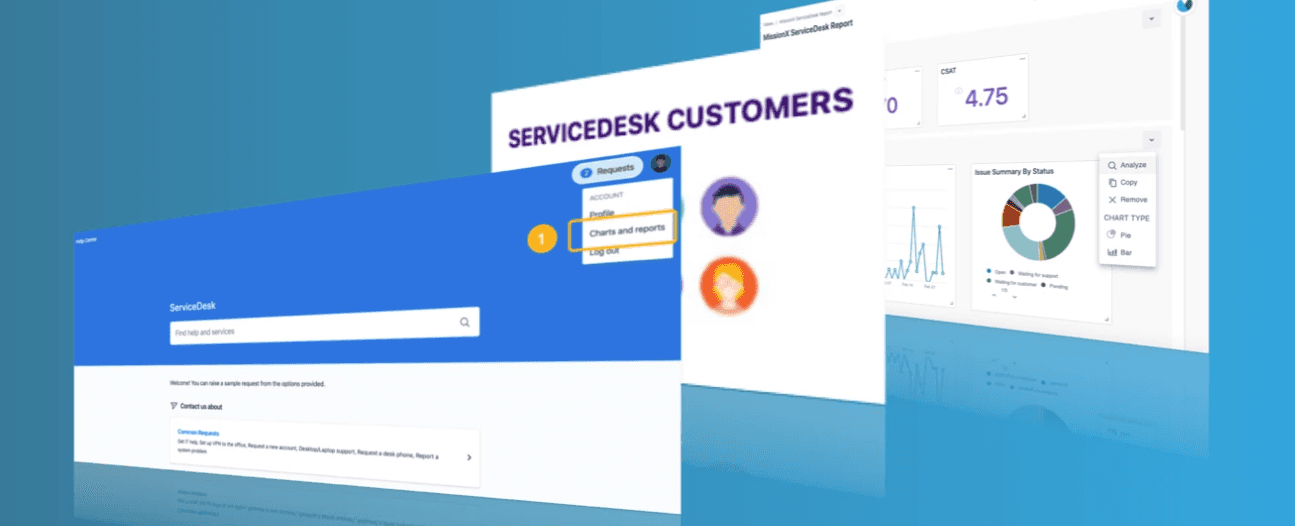
Getting SLA reports from Jira Service Management
Jira Service Management (JSM) sure has many features, and SLA reporting is one among them. JSM provides robust built-in SLAs (service level agreements), so teams can track how well they’re meeting the level of service expected by their customers.
In this article, we look at the several ways in which you can obtain SLA reports.
SLA Tracking
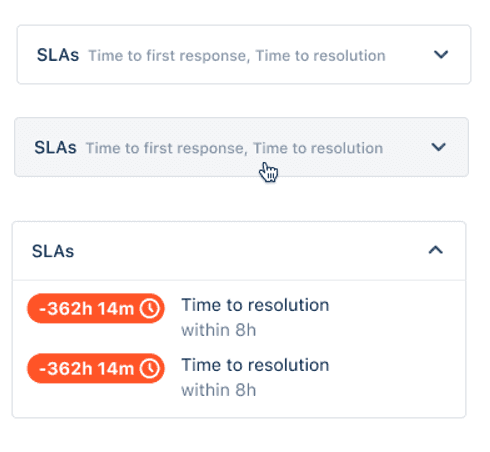
Once you have set up SLAs for a project, agents can view their SLAs and plan which tasks need to be resolved first and the time frame in which they should be resolved.
Project-specific Reports
JSM Projects out of the box allow admins to create custom reports that help you track specific team goals.
To view your service project’s reports or create new ones, select Reports in your service project sidebar.
Many more custom reports come with JSM out of the box. The following are just a few of them.
- Created vs. Resolved (compares the number of requests being created and resolved over time)
- Time To Resolution (shows how long it’s taking to resolve requests)
- SLA Met versus Breached (compares the number of requests that have met or breached a service level agreement (SLA) goal)
- SLA Success Rate (shows how your team is tracking towards their SLA goals)
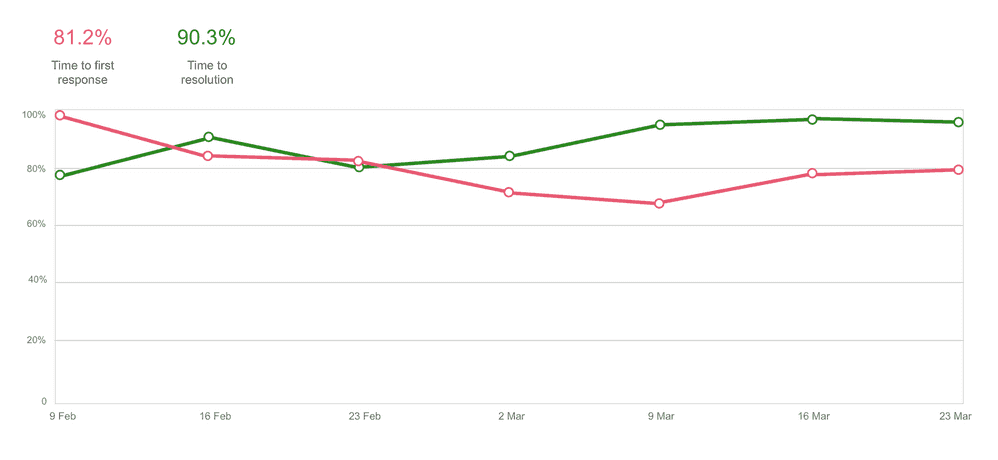
You can create your custom reports or edit the custom reports by adding a series, a set of data points used to make your reports, e.g., the number of requests received in the week. Chart customization includes label name for the series, select a color, and filter the series using standard fields (e.g., issue type, status, and component) or Jira Query Language (JQL).
SLA reports in Jira Dashboard
If you are a person who works on multiple service projects, you can add gadgets to a dashboard to view reports from those service projects in one place. The “Filter Counts” Gadget helps you to select a single project and search using multiple options. There is a list of options to choose from, and these include SLA’s. Below is a screenshot of how this looks like.
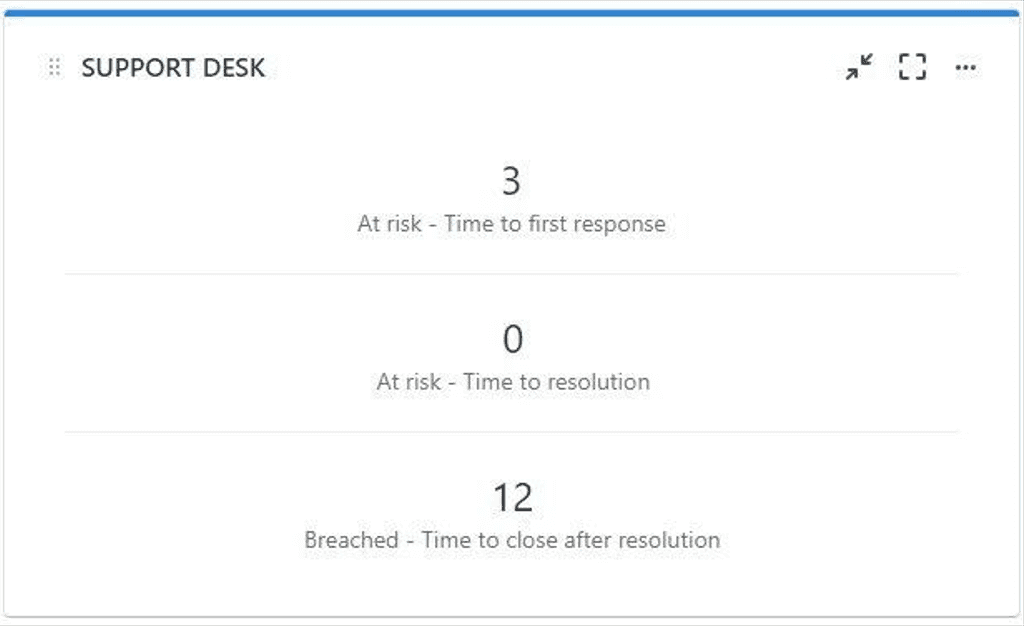
Service project report Gadget displays a custom report from a service project based on the configuration provided.
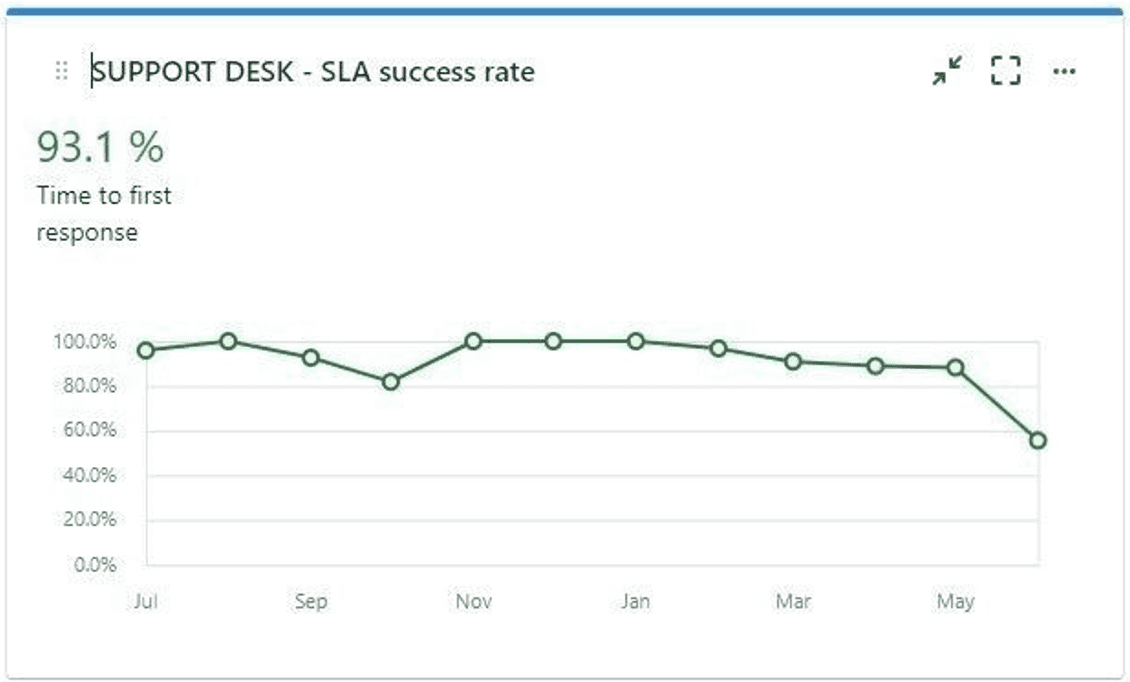
Jira Service Management (JSM) comes with several SLA reporting options allowing you to track your SLA goals. With everything you’ve learned from this post, you can begin to make better SLA charts in JSM, but if you need more control, give Charts & Reports for Jira Service Management a try.
Charts and Report for Jira Service Management
Charts and Report for Jira Service Management is a simple yet powerful reporting tool that allows you to create custom dashboards and share them with your Jira Service Desk Customers.
Key FeaturesCreate overall satisfaction, SLA & custom Jira reports & charts across all of your Jira Service Management projects within minutes.
Publish and Share Service Desk Reports with all your stakeholders and bring transparency to people even outside the Service Management team.
Drill down into data to discover insights. Slice and dice your data, analyse ticket age, and optimise your cycle time.
Perform detailed analysis across projects with powerful filtering and data analysis tools.
Customize colours and Group Legends with the new Chart Builder.
Get a bird view of Dynamic and interactive dashboards consisting of various data visualisation charts and graphs.
VIEW26 Charts & Reports allows you share reports with external customers via the JIRA ServiceDesk Customer Portal.
Have a quick look at the video to get started :-
Try it for yourself at the
Atlassian Marketplace for free! ✨Marketing Manager - VIEW26
PRODUCTS

